View via Grafana
Persistently save backend service logs through Grafana + Loki.
The following content only applies to environments deployed using ocboot.
Since version 3.7.6, the operator service combined with kubeserver will deploy grafana and loki by default to provide functionality for viewing backend service logs.
To view logs, just log in to grafana. The default grafana access method exposes the service via ingress.
Access Grafana
- The Grafana access address defaults to
https://control node IP address/grafana.
- Default login user:
admin - Password can be obtained by executing the following command on the management node: (Note: This password will become invalid if modified through the grafana frontend)
# Get admin default administrator login password
$ kubectl get oc -n onecloud default -o=jsonpath='{.spec.monitorStack.grafana.adminPassword}'
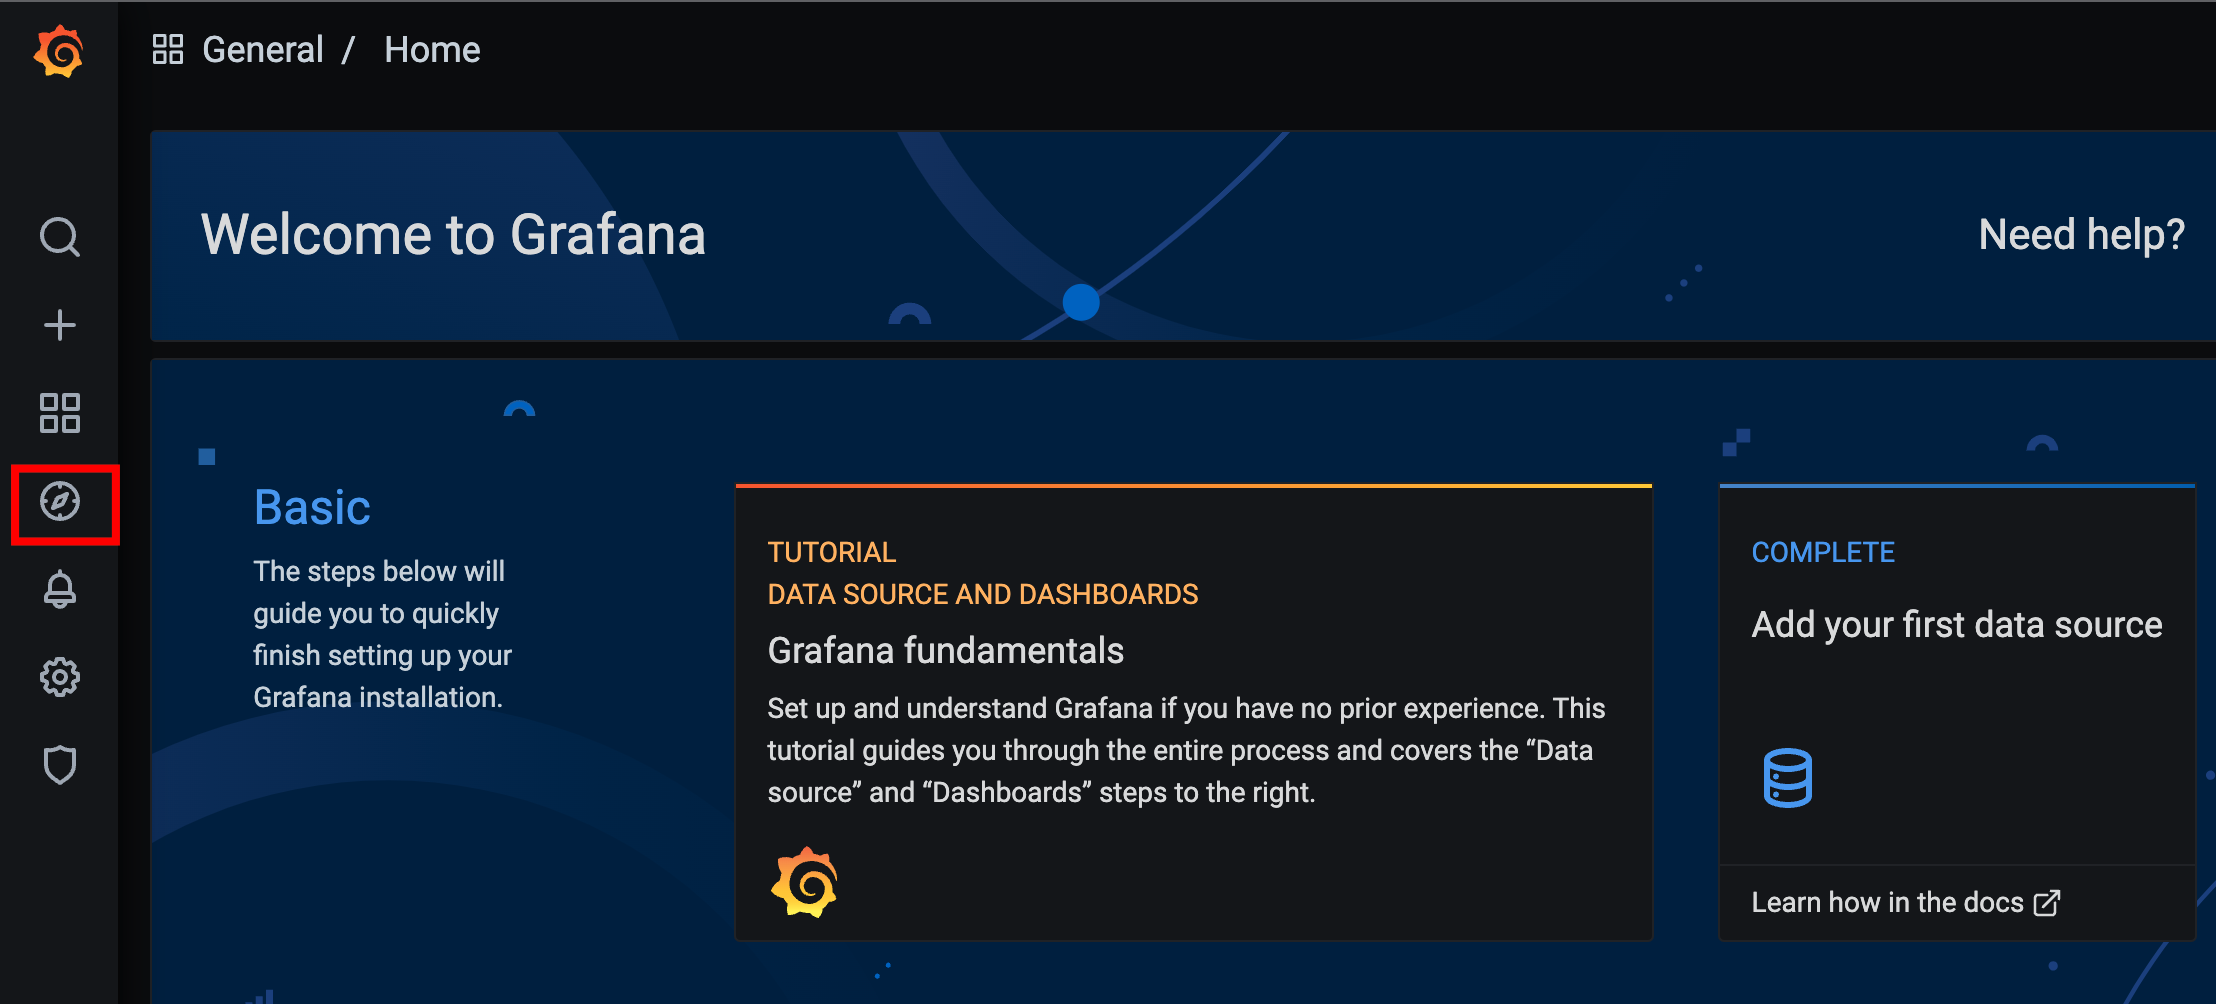
- Click the explore button in the figure above to enter the Loki log query page. On this page, you can query host pod logs of a node, etc. Enter
{app="host",hostname="testhost"}in the query conditions, and the host pod logs on that node will be displayed below.
Query Conditions
Loki's log service queries filter by labels. Common labels include "app" corresponding to service name, "hostname" corresponding to the machine where the pod is located, "container_name" corresponding to container name.
# For example, to view logs of the "ovn-north" container
{container_name="ovn-north"}
# View host service logs on node test
{app="host",hostname="test"}
# View baremetal service logs
{app="baremetal-agent"}
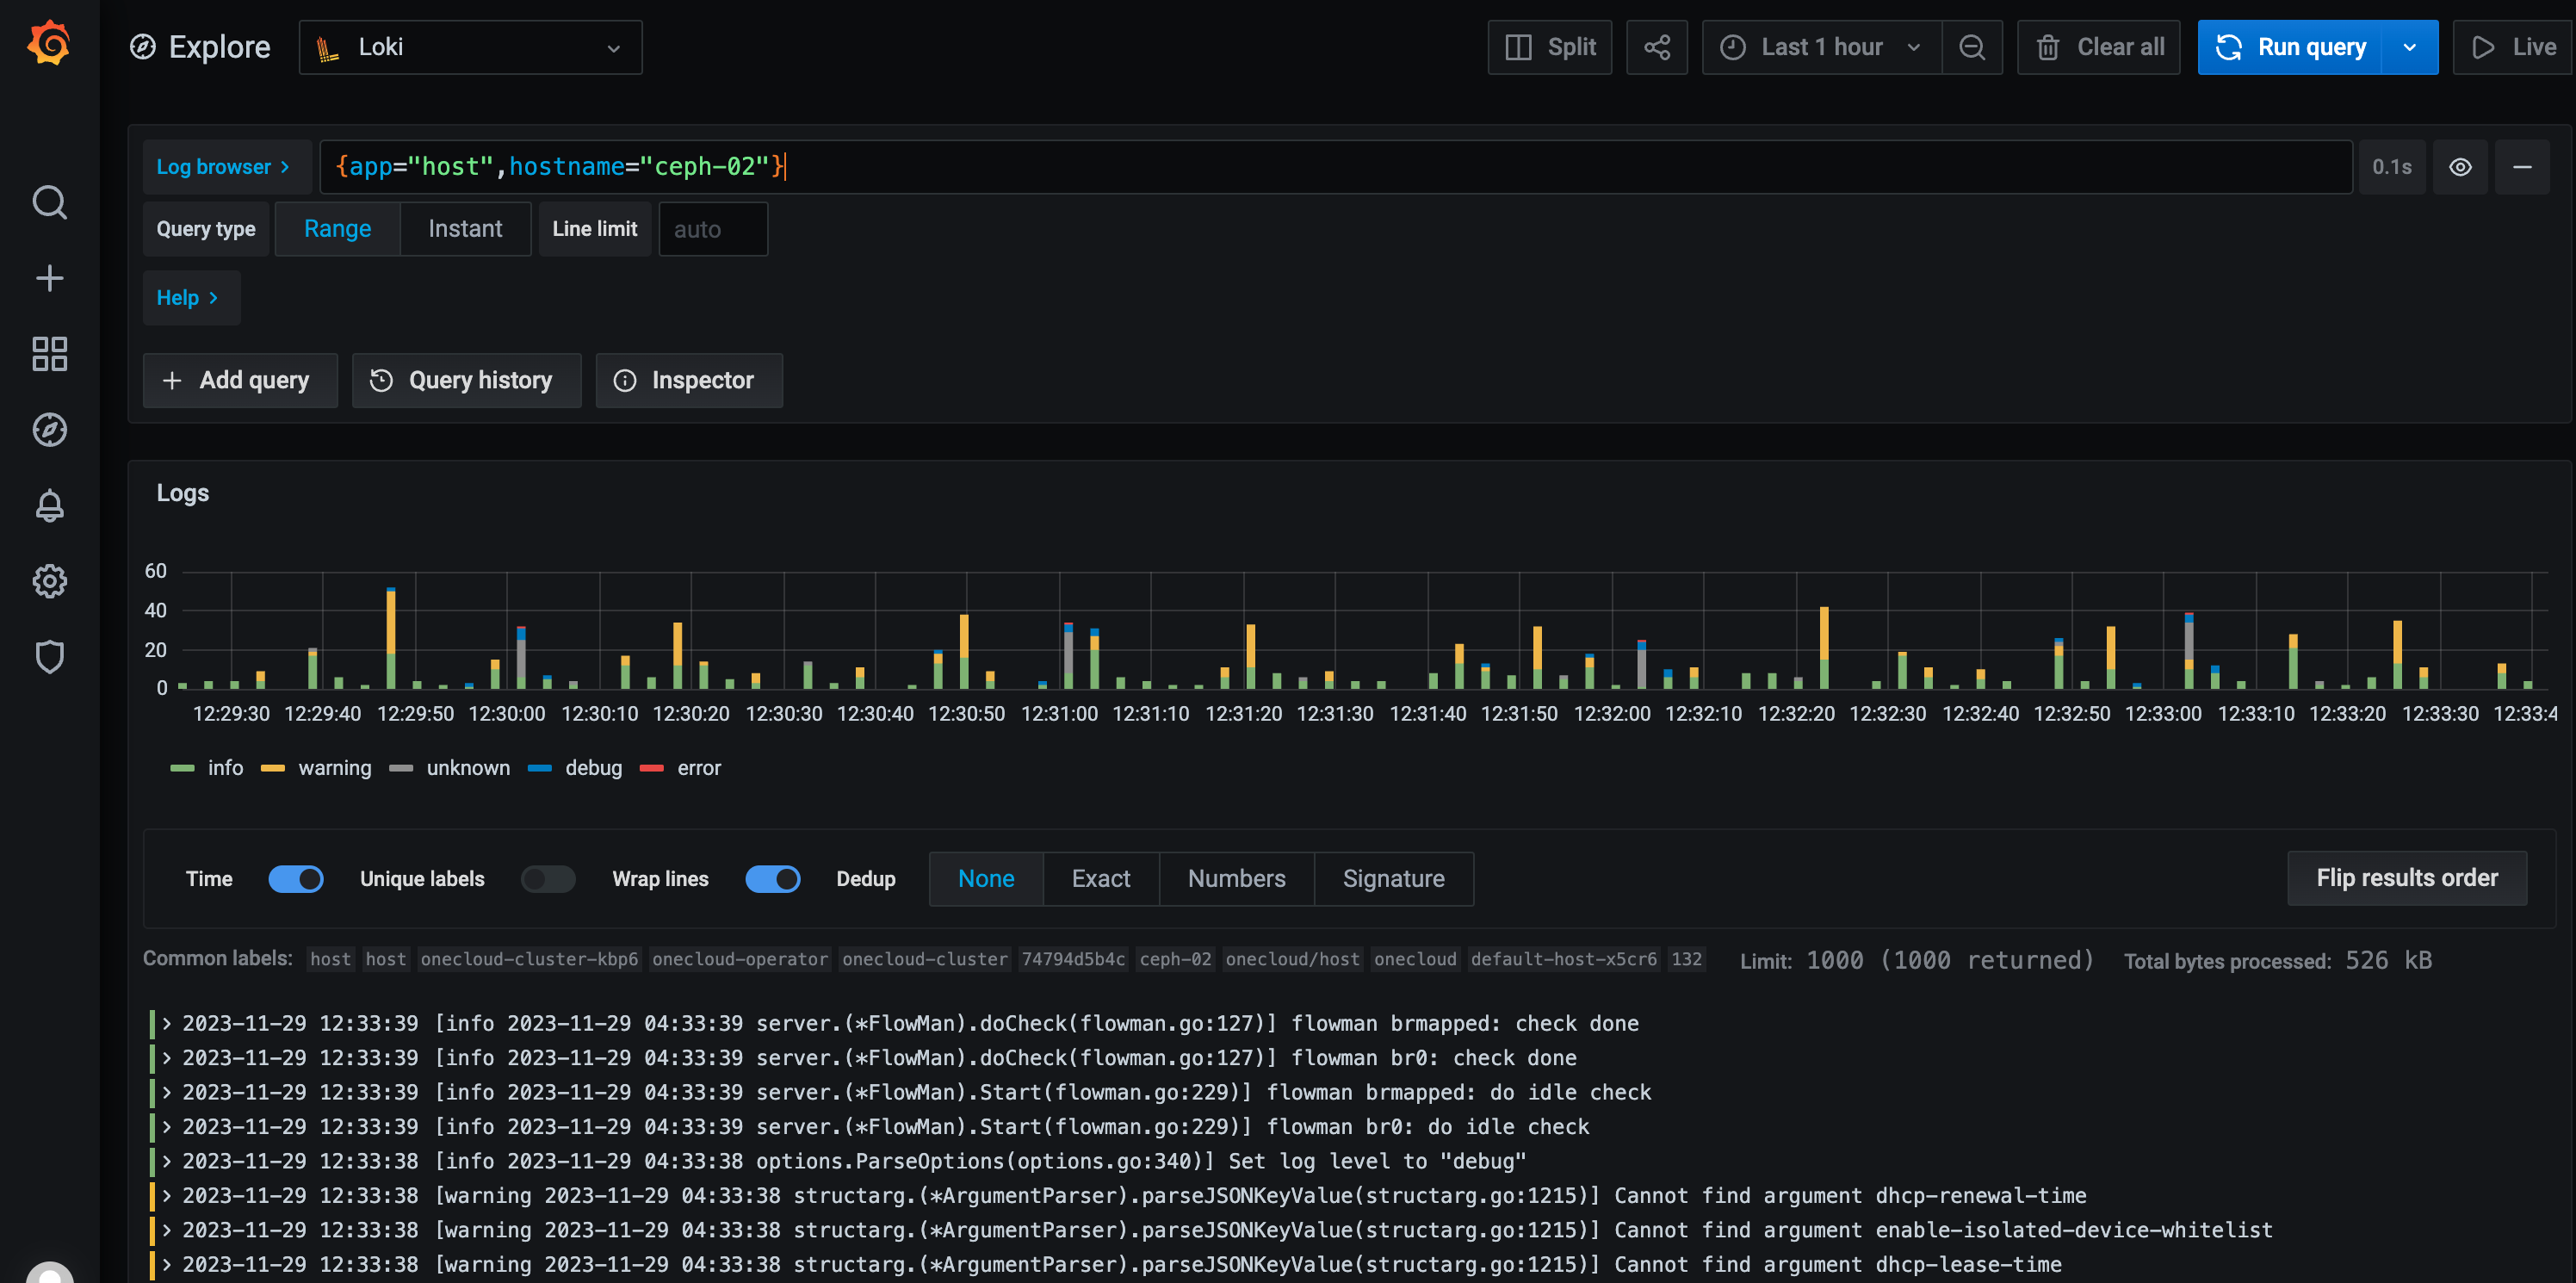
# Filter host service logs, hostname is ceph-02, and contains the keyword error
{app="host",hostname="ceph-02"} |= "error"
For more query usage methods, please refer to: Loki Log queries .
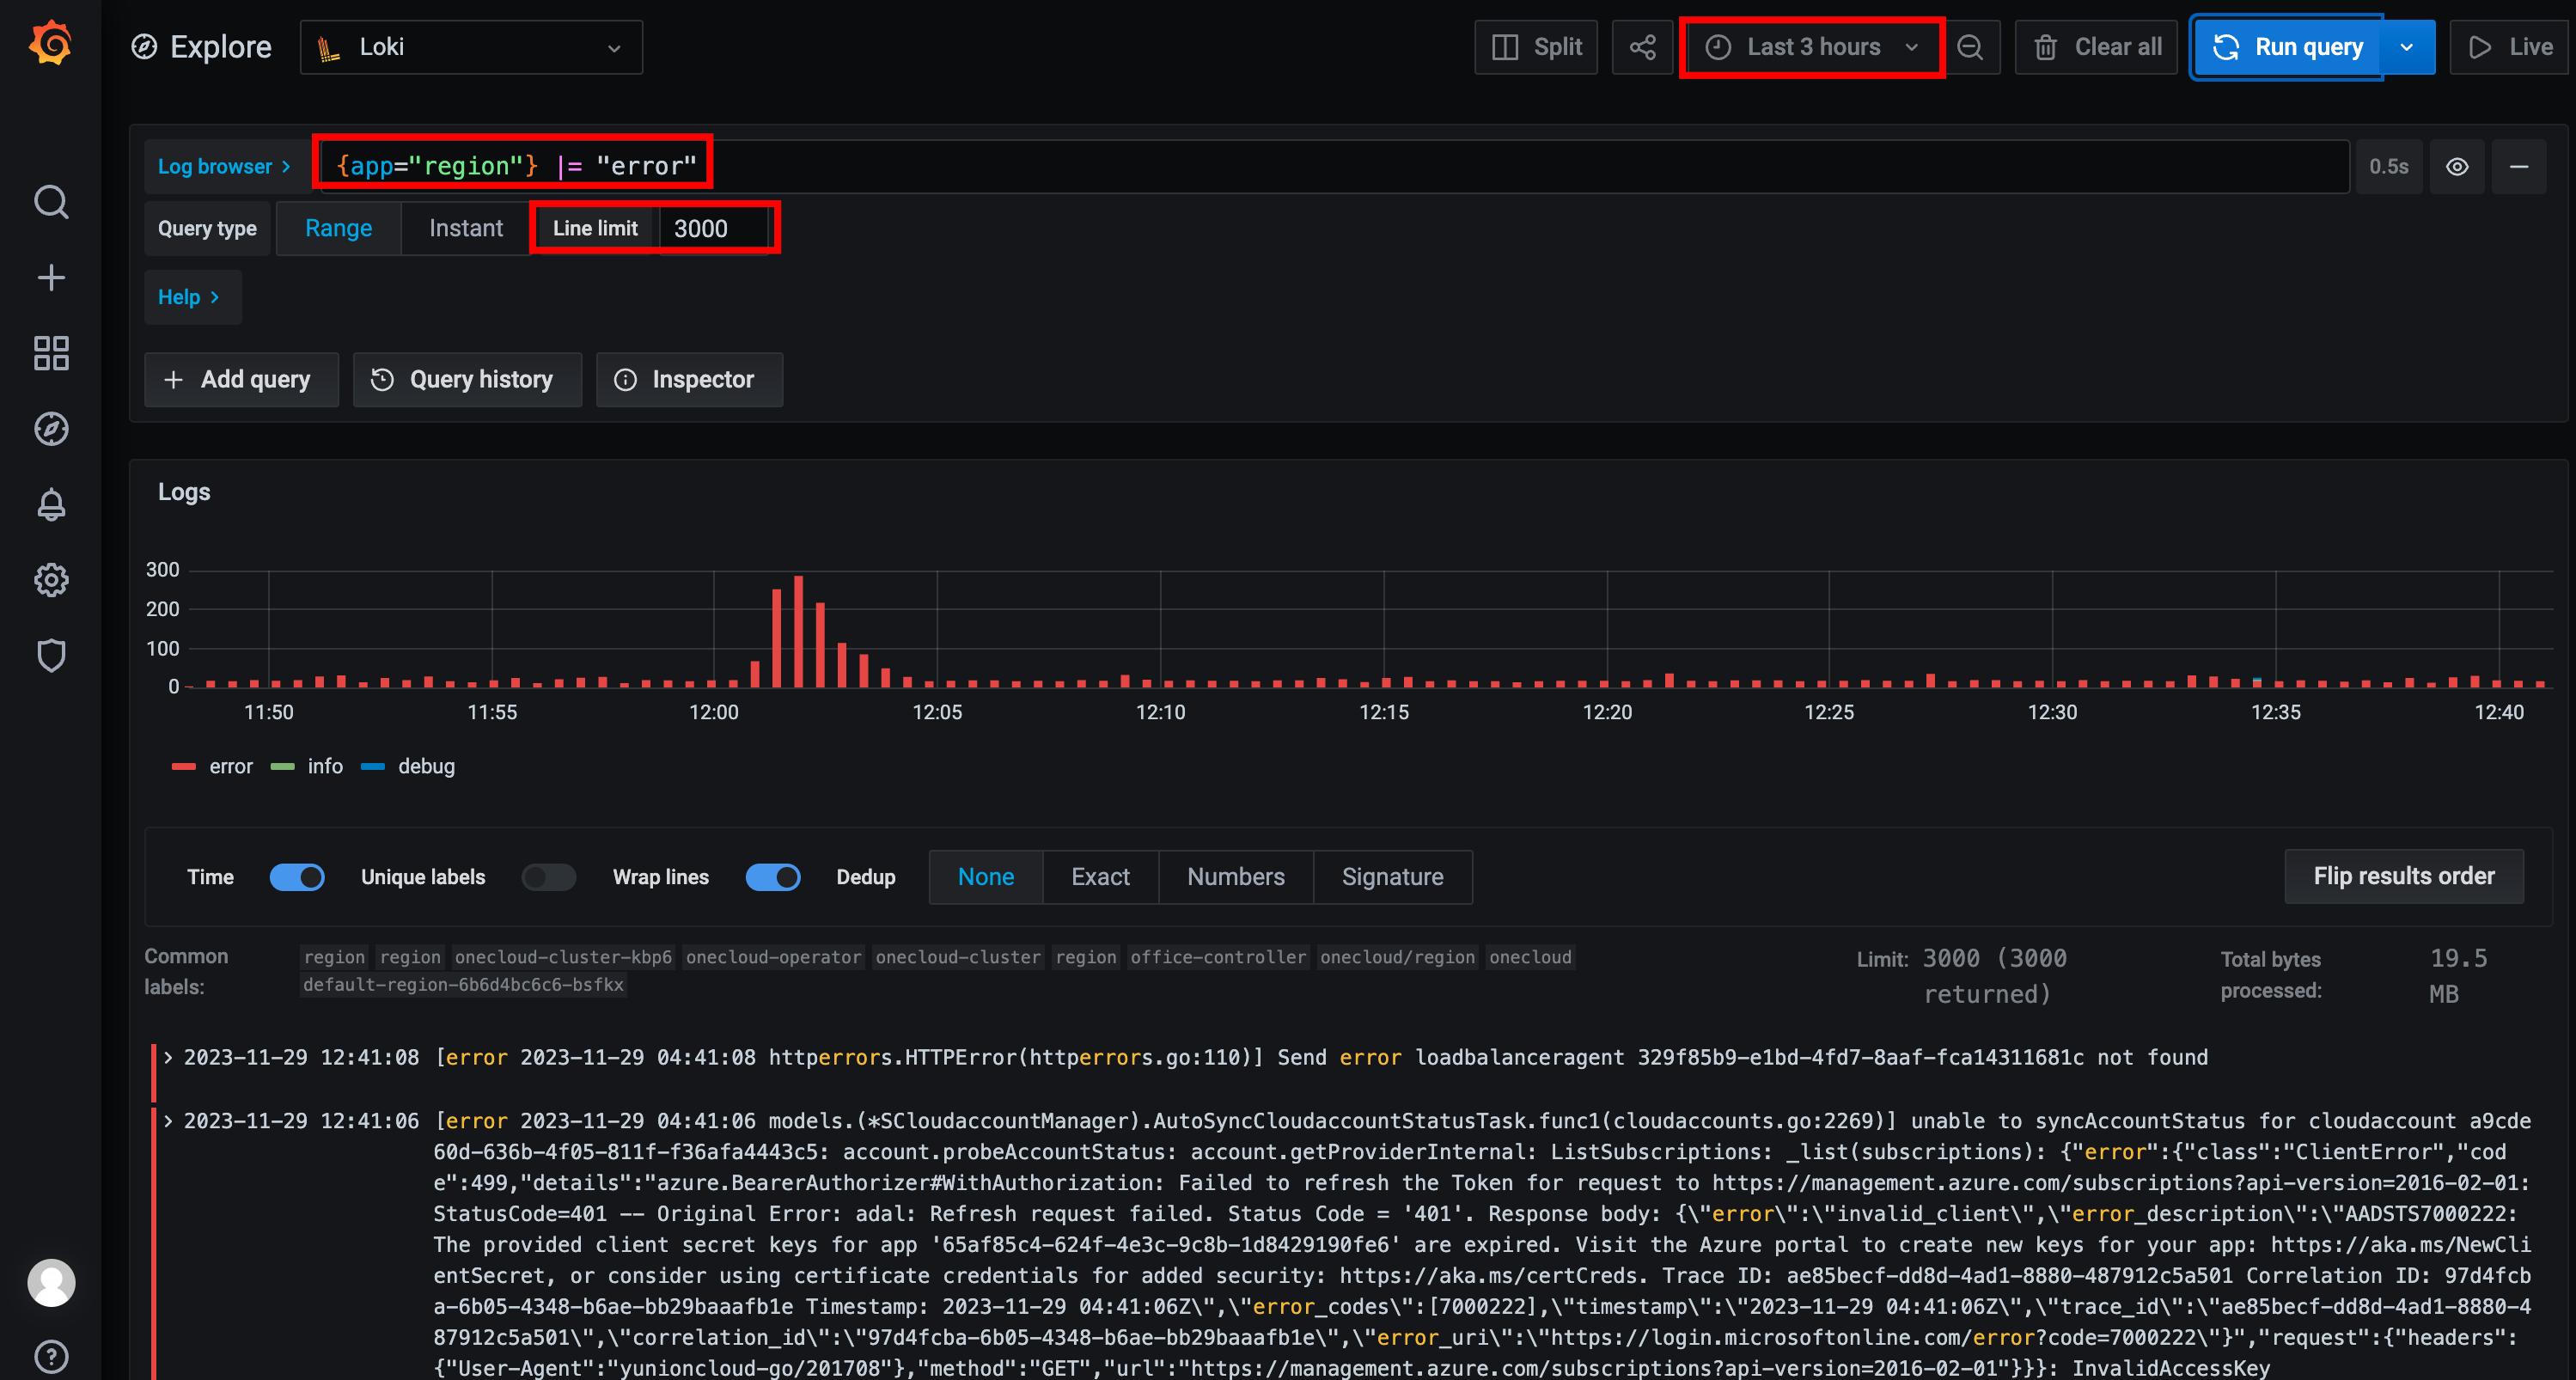
Usage Example
For example, query region service logs from the past 3 hours containing the keyword error.
The query condition can be set to {app="region"} |= "error", and the time filter set to "Last 3 hours".
Disable grafana
Disable grafana by modifying oc, setting monitorStack->grafana->disable to true